NIFTY 50
As on 19 Jun, 2025 03:19pm.
Loading...
0.00 (0.00%)
*As mandated by Exchange & other statutory authorities, the data feeds are delayed by 15 mins.
Range
Daily
52 Weeks
Daily Low
Daily High
0.00
0.00
Open
0.00
Prev.Close
0.00
Volume
0
Gift Nifty is trading at 24745.00, down by 64 points, indicating negative opening for Nifty
Rupee Desk - USD/INR: Currently trading at 86.61
Short term - Technical Outlook
The Indian stock market is set to open on a negative note today, with GIFT Nifty trading at 24,745, down by 64 points, indicating a weak start. U.S., European, and Asian markets are trading in a negative note.
Global markets are under pressure due to rising tensions in the Middle East and the outcome of the U.S. Federal Reserve meeting. The Fed kept interest rates unchanged at 4.50% in its June policy (Actual: 4.50% | Previous: 4.50% | Estimate: 4.50%). Although this was expected, the Fed's indication of fewer rate cuts in 2025 than earlier anticipated has created uncertainty. Higher crude oil prices and a strong U.S. dollar are also impacting sentiment.
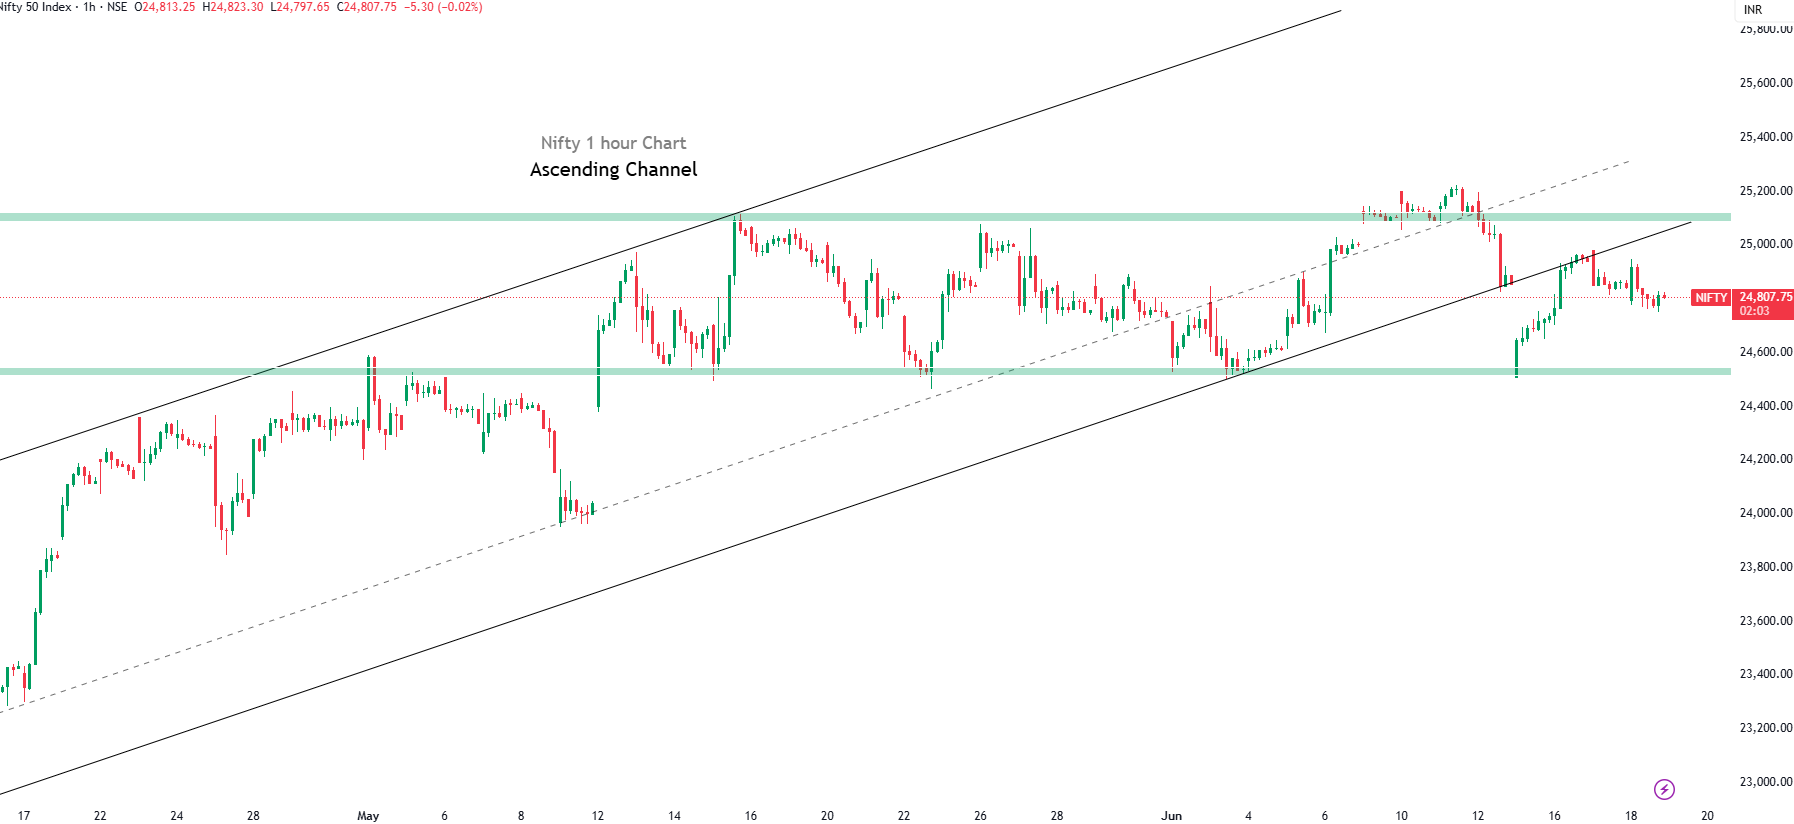
Nifty is currently facing resistance in the 25,050–25,070 range. A breakout above this level could open the path toward 25,350–25,600. The index continues to trade within an ascending channel. In the previous session, Nifty closed at 24,812, down by 41 points. An intraday move above 24,850 could trigger further upside momentum, while a fall below 24,750 may indicate short-term weakness. Holding above 25,000 remains essential for sustaining bullish sentiment. A buy-on-dip strategy can be considered if institutional flows remain supportive.
FIIs were net buyers, bought ?890 crore, while DIIs provided strong support, buying ?1,091 crore. Sustained domestic flows are expected to cushion downside pressures.
Short term Research Report Call
Buy Above: 24,850 | Targets: 24,950, 25,080, 25,150 | Stop-loss: 24,780
Sell Below: 24,750 | Targets: 24,670, 24,600, 24,500 | Stop-loss: 24,820
Short term Chart
Long term - Technical Outlook
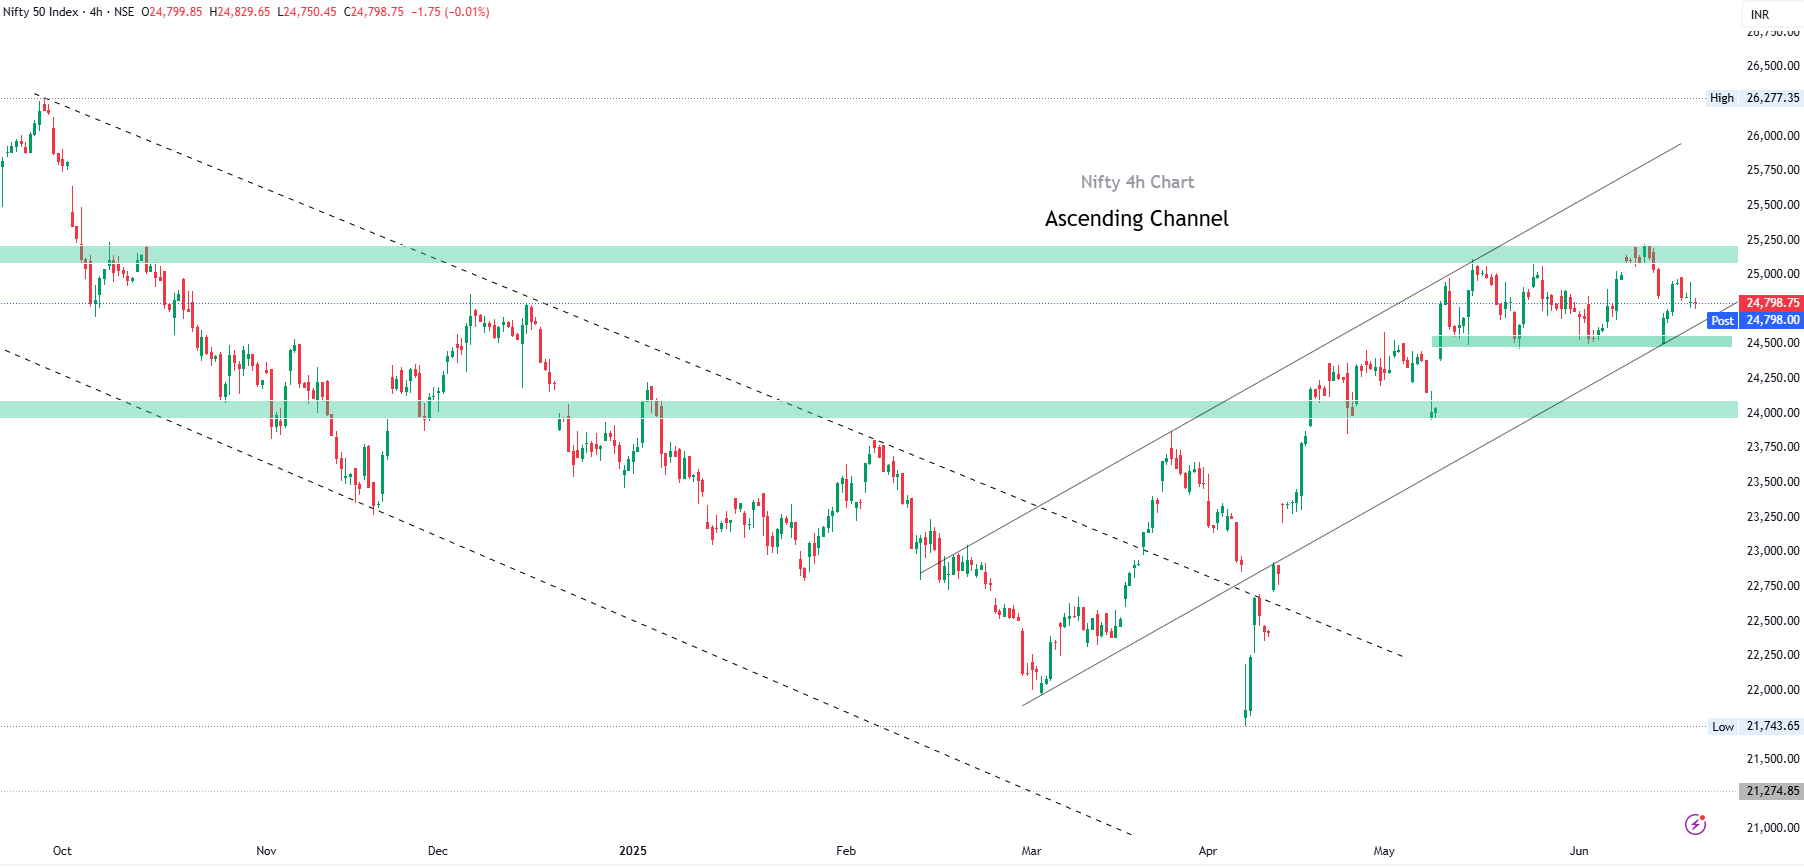
Nifty is currently trading within a broken descending channel on the 4-hour chart. If it sustains above the 24,500 level, momentum is expected to build toward the 24,800 range, while a breakdown below 23,900 may trigger additional downside pressure.Investors and short-term traders can consider a buy-on-dips strategy for the long term, as the market is currently trading at attractive valuations. Quality investments at these levels are likely to yield strong long-term returns.
Long term Research Report Call
Buy Above: 24,500 | Targets: 24,800, 25,150, 25,500 | Stop-loss: 24,200
Sell Below: 23,900 | Targets: 23,500, 23,350, 23,000 | Stop-loss: 24,100
Long term Chart
Market View
June 18th 2025
Market View
Resistance 24,900

Support 24,700
FII & DII Activities
Particular
FIIs
DIIs
Net Purchase/ Sales (Cr)
27 May 2025
+1,482.77
+8,207.19
MTD-May (Cr)
June
-5,869.04
+58,138.87
Indian equity benchmarks opened on a weak note on Wednesday, June 18, following a sharp gap-down start. However, the indices staged a strong intraday recovery, with the Sensex rebounding over 550 points from the day’s low and the Nifty reclaiming the crucial 24,900 mark after briefly slipping below 24,800. The rebound was supported by renewed buying interest in major sectors, helping the indices recover from early losses. Despite the bounce, some pressure remained due to weakness in the banking space.
Sectorally, the market saw broad-based buying, with all major sector indices trading in positive territory. The auto sector led the gains with over 1% rise, followed by strength in financial services, FMCG, pharma, and realty. The broader markets also supported the upmove, with midcap and smallcap indices trading in the green. Market breadth was positive in early trade, indicating widespread participation across sectors and stock categories.
Global sentiment, however, remained cautious. Tensions in the Middle East escalated further with renewed missile exchanges, pushing crude oil prices to a five-month high. Asian markets traded mixed amid concerns that further escalation could lead to broader geopolitical and economic risks. Despite the uncertain global backdrop, domestic markets found support from selective buying, contributing to the strong intraday reversal.
Global Market
June 19th 2025
NASDAQ
USA
19,546.27
25.18 0.13
19th June
Dow Jones
USA
42,061.06
-110.6 -0.26
19th June
FTSE
UK
8,843.47
9.44 0.11
18th June
DAX
GERMAN
23,317.81
-116.84 -0.5
18th June
GIFT Nifty
Singapore
24,785
-25 -0.1
19th June
NIKKEI 225
Japan
38,586.91
-298.24 -0.77
19th June
Shanghai
China
3,375.34
-13.47 -0.4
19th June
S&P 500
USA
5,980.87
-1.85 -0.03
19th June
Market at Closing
March 20th 2025
Top Gainers
| BHARTIARTL | 1,704 66.85 4.08 |
| TITAN | 3,183.05 106.75 3.47 |
| EICHERMOT | 5,234 133.1 2.61 |
| BAJAJ-AUTO | 7,920 198.15 2.57 |
Top Losers
| INDUSINDBK | 685 -7.7 -1.11 |
| BAJFINANCE | 8,680 -51.6 -0.59 |
| TRENT | 5,215 -15.85 -0.3 |
| SHRIRAMFIN | 666.3 -1.65 -0.25 |
Technicals
Pivot Advanced Levels
Check live levels for all scripts
Buy Above
24868.22
R1
24911.58
R2
24956.91
R3
25037.73
Stop Loss
24816.97
Pivot
24836.68
(All values are in INR)
Sell Below
24805.15
S1
24761.79
S2
24716.45
S3
24635.64
Stop Loss
24856.39
Pivot Basic Levels
| R4 | R3 | R2 | R1 | Pivot | S1 | S2 | S3 | S4 | |
| Classic | 25206.25 | 25120.02 | 25033.78 | 24922.92 | 24836.68 | 24725.82 | 24639.58 | 24528.72 | 24417.85 |
| Woodie | 25421.83 | 25107.70 | 25027.62 | 24910.60 | 24830.53 | 24713.50 | 24633.43 | 24516.40 | 24239.23 |
| Camarilla | 24920.46 | 24866.25 | 24848.18 | 24830.12 | 24836.68 | 24793.98 | 24775.92 | 24757.85 | 24703.65 |
Moving Averages
Bullish
Bearish
EMA
SMA
5 Day
20749.30
10 Day
19842.16
20 Day
19151.32
50 Day
18524.64
100 Day
18185.38
200 Day
17871.51
Momentum Oscillators
Stoch RSI
55.92
ROC
1.00
Ultimate
47.62
Williams
-57.98
CCI
-27.58
Stochastic
46.01
RSI
65.56
Bullish
1
Bearish
0
Neutral
6
Trend Oscillators & Volatility
ATR
129.20
High Volatility
MACD
380.54
Bullish
Bullish
1
Bearish
0
Neutral
0
Nifty Stock List
Check all stocks
| Stock Name | CMP | Change (%) | Market Cap (Cr.) | Sector | Piotroski Score |
| RELIANCE | 1433.1 | 0.2098 | 1934940.65 | Oil & Gas | 7 / 9 |
| HDFCBANK | 1935.7 | 0.0931 | 1482897.86 | Banks | 3 / 9 |
| HDFCBANK | 604.5 | 1.0616 | 1482897.86 | Banks | 3 / 9 |
| TCS | 3419.4 | -0.9272 | 1249036.15 | Software & IT Services | 7 / 9 |
| BHARTIARTL | 1875.4 | 0.5091 | 1136695.71 | Telecom | 8 / 9 |
Disclaimer: Investment in securities/commodities market subject to market risk, read all the related documents carefully before investing/trading.
Analyst Certification: I/We, Ayushi Jain Research Analyst, authors, and the name subscribed to this report, hereby certify that all the views expressed in this research report accurately reflect our views about the subject issuer(s) or securities. We also certify that no part of our compensation was, is, or will be directly or indirectly related to the specific recommendation(s) or view(s) in this report. NISM Research Analyst registration number – NISM-201900015194.
Frequently asked questions
Can I trade NIFTY50?
How are stocks selected to be a part of Nifty 50?
How does the closing price of NIFTY50 determined?
What are Nifty Futures and Options?
