Crude Oil
Thursday 19 June, 2025
Short term - Technical Outlook
Crude Oil is currently trading in a Ascending Channel in 4 hour chart. In the last session, it closed at 6453 up by 27 points. Sustaining above 6400 could be good for crude oil, while immediate support is placed at 6000
Further intraday upside momentum is likely above 6470 while a breakdown below 6420 could trigger additional selling pressure.
Short term Research Report Call
Buy Above: 6470| Targets:6500,6573,6650 | Stop-loss: 6430
Sell Below: 6420| Targets: 6400,6350,6300 | Stop-loss: 6450
Short term Chart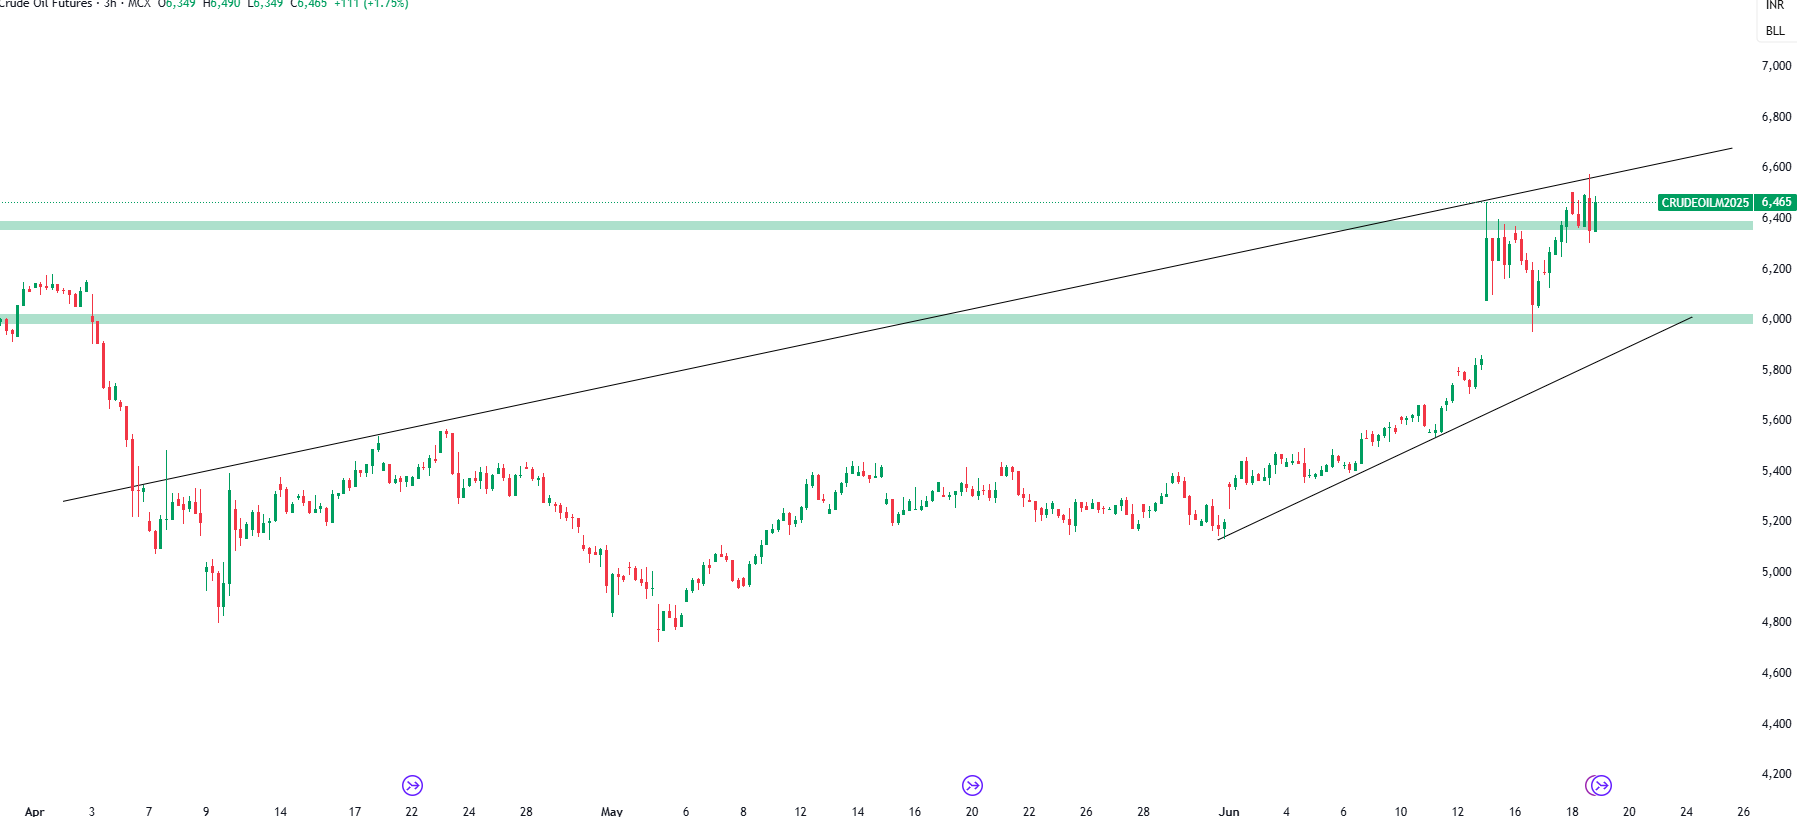
Validity
18/06/2025
Pivot
6454.33
Buy Above
6497.85
R1
6557.69
R2
6620.25
R3
6731.77
Stop Loss
6481.53
Pivot
6454.33
(All values are in INR)
Sell Below
6410.81
S1
6350.97
S2
6288.41
S3
6176.89
Stop Loss
6481.53
Gold
Thursday 19 June, 2025
Short term - Technical Outlook
In the last session, Gold closed at 99537 at flat. Gold is trading in an ascending channel on the wider timeframe and in a descending channel on the shorter timeframe, as shown in the chart.
Sustaining above 98000 could be good for Gold. A sustained move above this range could lead to further upside in Gold.For intraday traders, a move above 99600 may indicate upside potential, while a dip below 98700 could trigger further downside pressure.
Short term Research Report Call
Buy Above: 99600 Targets:,99900,100350,100800| Stop-loss: 98800
Sell Below: 98700| Targets: 98500,98000,97500 | Stop-loss:99400
Short term Chart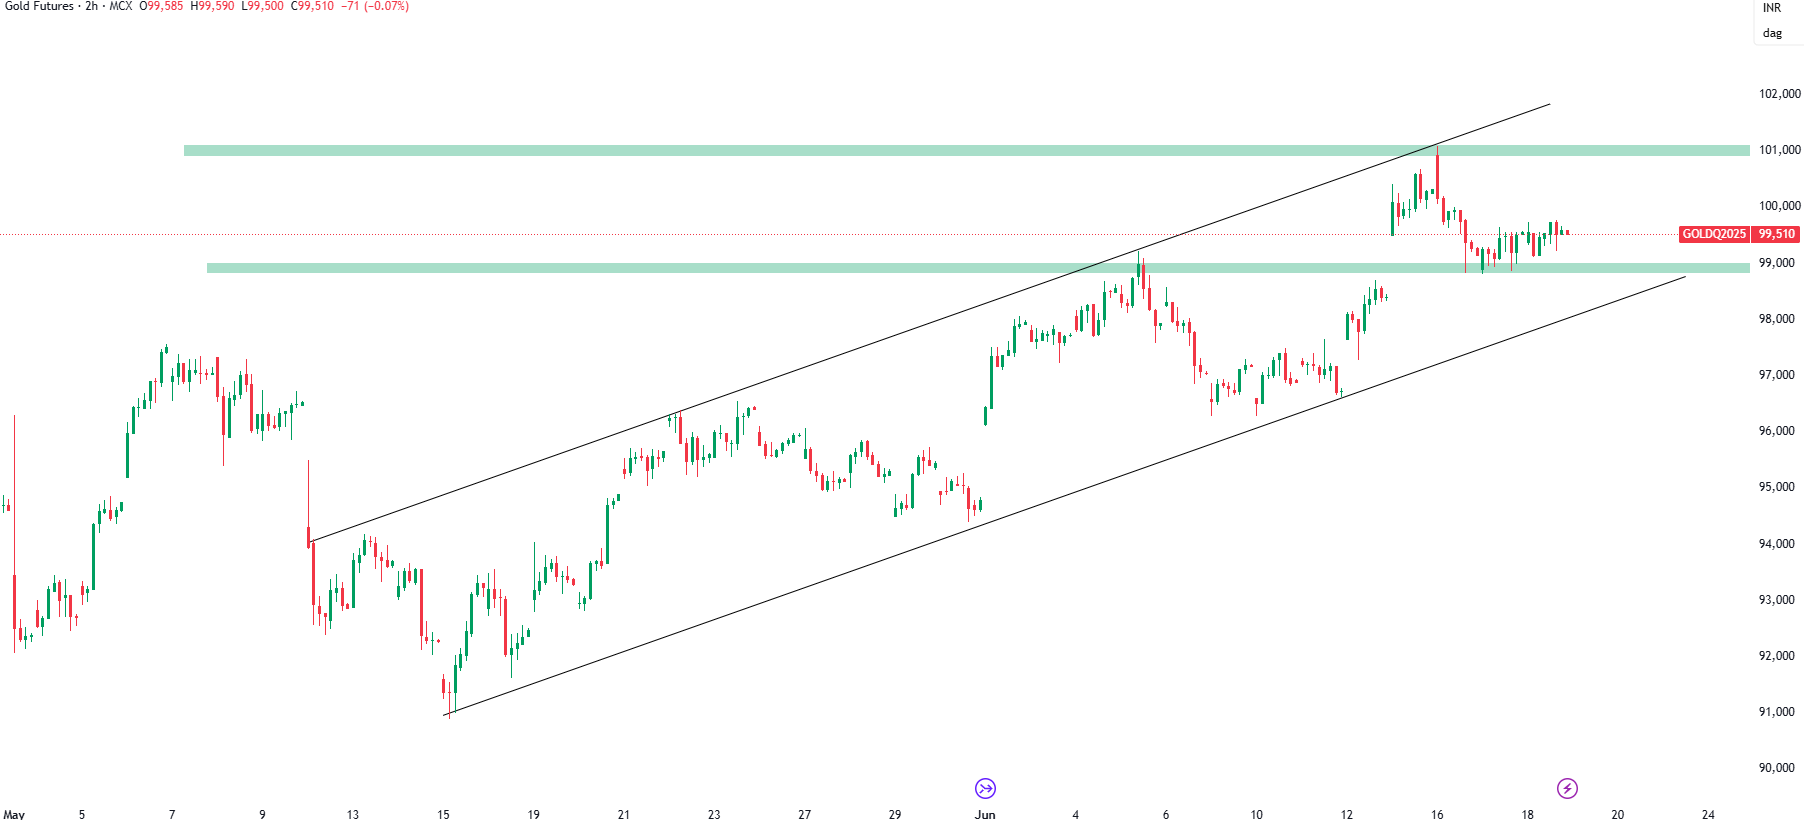
Validity
05/08/2025
Pivot
99472.67
Buy Above
99578.43
R1
99723.85
R2
99875.88
R3
100146.89
Stop Loss
99538.77
Pivot
99472.67
(All values are in INR)
Sell Below
99366.91
S1
99221.49
S2
99069.46
S3
98798.45
Stop Loss
99538.77
Natural Gas
Thursday 19 June, 2025
Short term - Technical Outlook
Natural Gas is currently trading in a Ascending channel shwoing a uptrend. The last session closed at 344.6 up by 15.5 points. Another intraday move is likely above 340. However, a close below 324 could signal further downside in prices. Sustaining above 330 on a broader timeframe could lead to short-term bullishness in Natural Gas.
Short term Research Report Call
Buy Above: 348 Targets: 351,355,360 | Stop-loss: 343
Sell Below: 340| Targets: 336,333,326| Stop-loss: 344
Short term Chart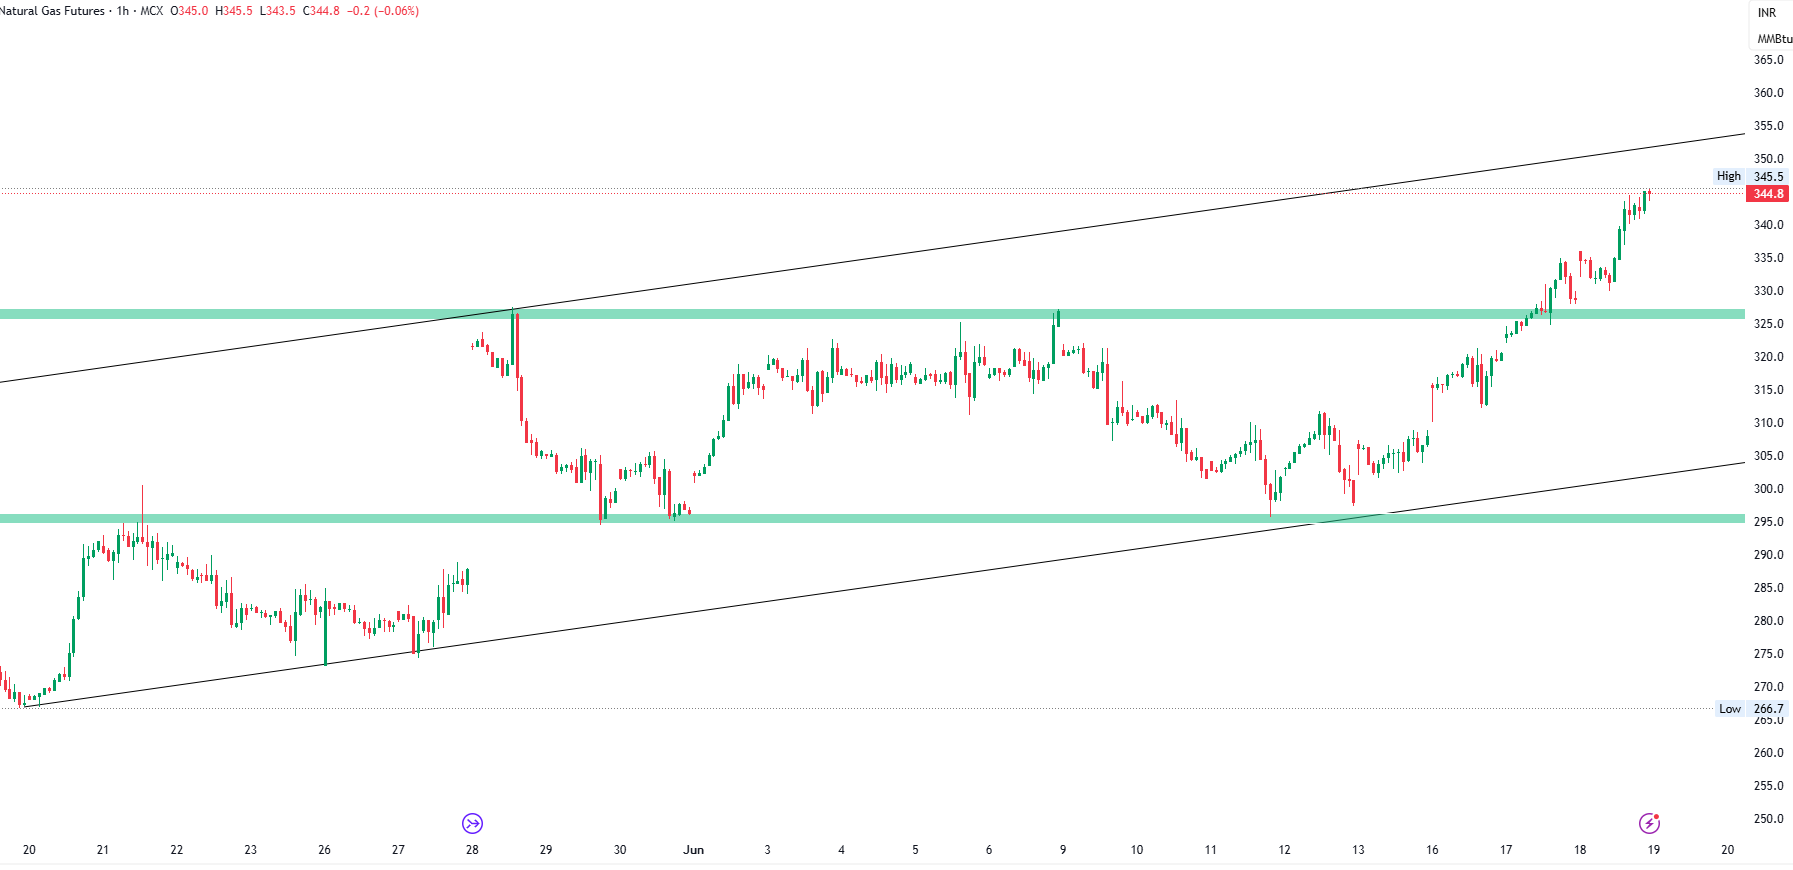
Validity
25/06/2025
Pivot
340.00
Buy Above
342.50
R1
345.93
R2
349.52
R3
355.91
Stop Loss
341.56
Pivot
340.00
(All values are in INR)
Sell Below
337.50
S1
334.07
S2
330.48
S3
324.09
Stop Loss
341.56
Note: Above information is not recommending any buy or sell position, this is for your reference only and trading or investment in commodities & derivatives is subject to market risk.
Disclaimer: Investment in securities/commodities market subject to market risk, read all the related documents carefully before investing/trading.
Analyst Certification: I/We, Ayushi Jain Research Analyst, authors, and the name subscribed to this report, hereby certify that all the views expressed in this research report accurately reflect our views about the subject issuer(s) or securities. We also certify that no part of our compensation was, is, or will be directly or indirectly related to the specific recommendation(s) or view(s) in this report. NISM Research Analyst registration number – NISM-201900015194.
