ORCA Web Now Available with TradingView Charts!
ORCA Web is thrilled to announce the new integration of TradingView Charts features, which provides your trading platform best in class technical analysis functionality. With these feature-filled enhancements, charting, analysis, and response to market behavior have never been more convenient or empowering - all inside your acquainted ORCA Web interface.
Introducing TradingView Charts on ORCA Web – Next-Level Charting is Here!
Redefine Your Market Analysis. Upgrade Your Trading Journey.
ORCA Web is proud to unveil its latest enhancement—seamless TradingView chart integration! Designed for traders who demand precision and depth, this update transforms your familiar ORCA Web platform into a high-powered trading workstation with advanced charting tools, real-time data, and actionable insights—all in one place.
Integrated Market Data
The new TradingView integration brings vital market data in easily consumable format:
-
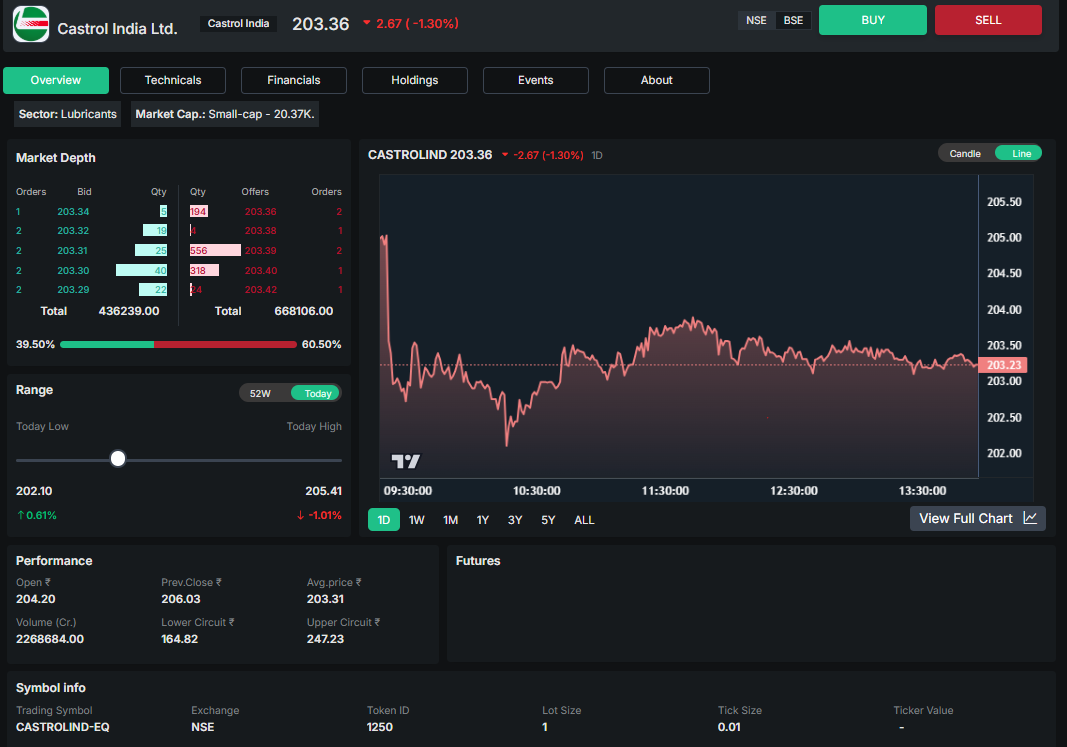
Live Price Updates – See up-to-date prices (Rs.203.36 in our example), daily ranges, and percentage changes (-1.30%)
-
Visualization of Market Depth – See live bid/ask data with volume at each price level
-
Order Book Analysis – See market sentiment with buy/sell ratio indicators (39.50% vs. 60.50%)
-
Key Statistics – See open, high, low, close, average price, and volume data at a glance
-
Circuit Limits – Watch out for day's price movement limits
Say hello to comprehensive market data, delivered in the most intuitive format:
Live Price Updates – View real-time prices (?203.36 in this example), daily trading ranges, and percentage changes (-1.30%).
Visualization of Market Depth – Access live bid/ask data with corresponding volumes at each price level.
Key Statistics – Instantly review key metrics including open, high, low, close, average price, and trading volume.
Circuit Limits – Stay informed of the day’s upper and lower price movement thresholds.
This integrated view provides the background details necessary for trading decisions, blending technical analysis and order flow intelligence into one window.
Seamless Integration into Your Trading Process
ORCA Web's TradingView Charts are not analysis tools alone—they're part of your trading process:
-
In-Market Trading Actions – Execute buy and sell orders from the charting window
-
Company Details Panel – View sector (Lubricants), market cap (Small-cap - 20.16K), and more
-
Support for Multiple Markets – Switch between NSE and BSE listings with a click
-
Advanced Chart Patterns – Recognize potential trading opportunities with established technical patterns
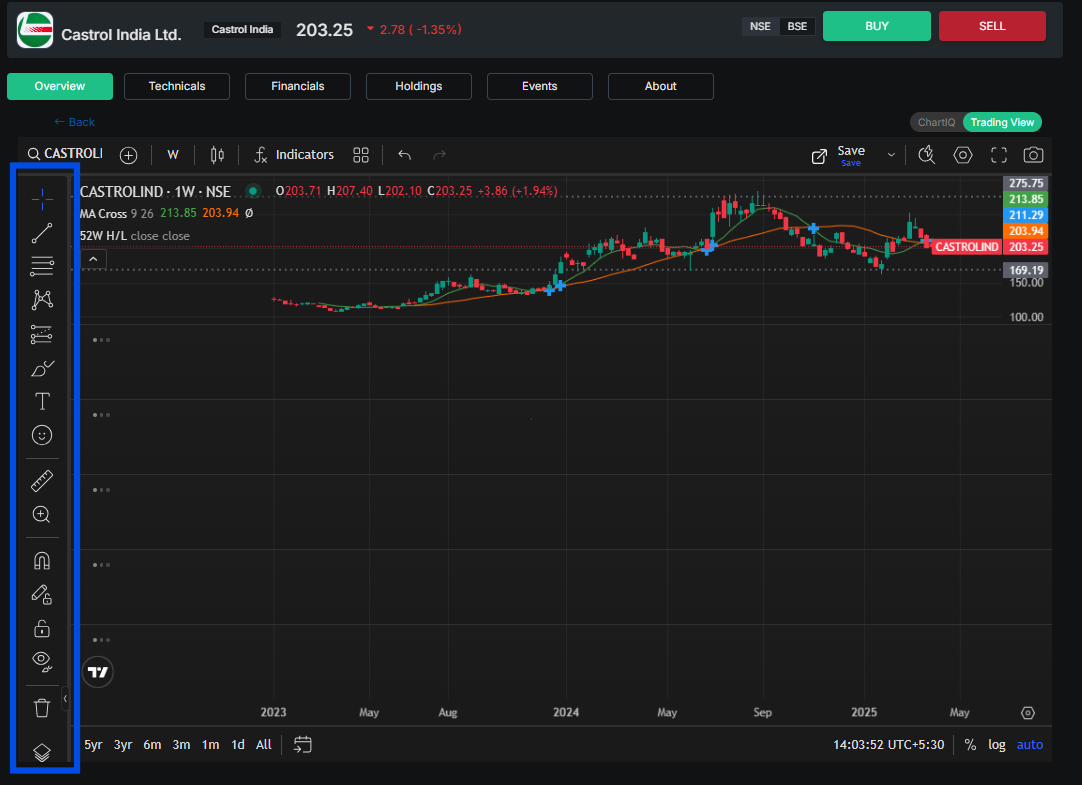
Professional Drawing Tools for Advanced Analysis
Mark important levels of support and resistance, chart patterns, and areas of possible breakout using TradingView's powerful set of drawing tools:
-
Trend Lines – Draw important highs or lows to set direction in the market
-
Fibonacci Tools – Determine probable reversal points based on mathematical ratios
-
Text and Annotations – Insert your analysis directly onto the chart
-
Shapes and Patterns – Identify chart patterns like head and shoulders, triangles, etc.
-
Measuring Tools – Calculate price targets as well as risk/reward ratios
They transform flat price charts into interactive analysis environments, helping you create and refine your trading strategies with precise visuals.
Draw, Annotate & Analyze Like a Pro
Whether you're mapping out support/resistance or identifying key breakout zones, TradingView’s drawing tools empower your strategy:
Trend Lines & Support Zones – Define critical price points to guide entries and exits.
Fibonacci Tools – Pinpoint potential reversal zones using time-tested ratios.
Text Notes & Markers – Add personal notes, mark levels, or highlight zones for future reference.
Price & Risk Calculators – Instantly calculate targets and risk/reward with measuring tools.
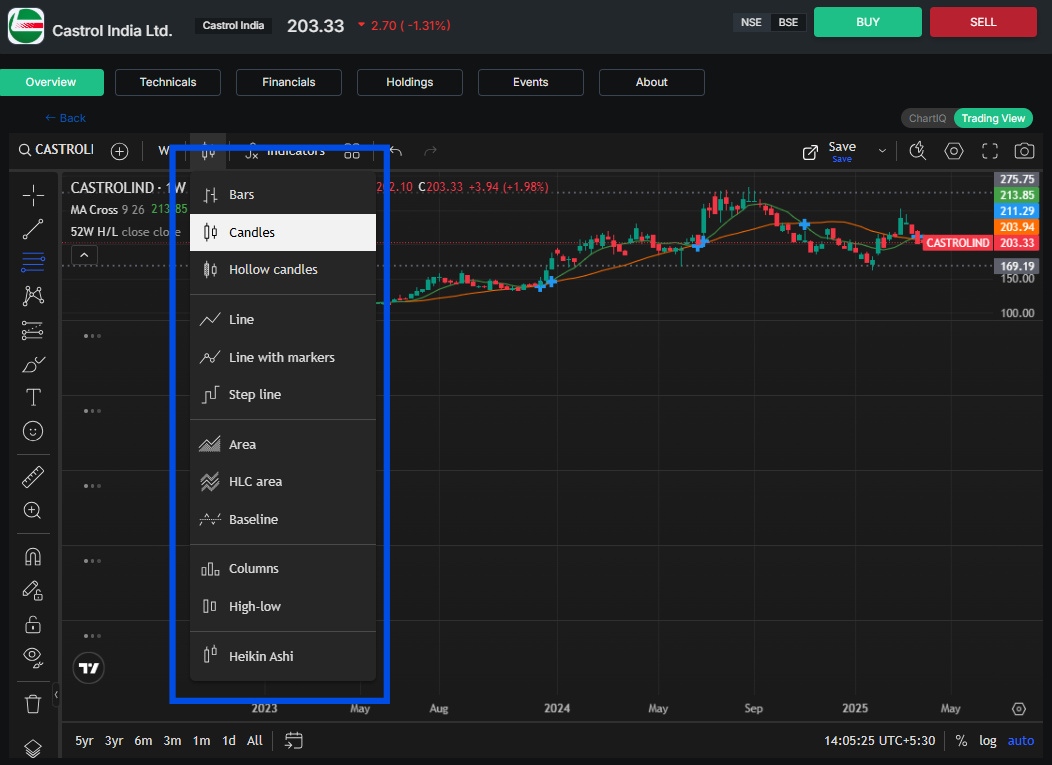
Advanced Types of Charts for Every Trading Method
The new TradingView integration offers a stunning set of chart visualizations to accommodate your individual analysis approaches. From the in-depth price action of candlestick charts, to the compact look of bar charts, right down to the trend focused look of line charts, ORCA Web has got you covered.
As our example on shows, you can seamlessly switch between:
-
Candlesticks - Display open, high, low, and close using intuitive color-coding
-
Hollow Candles - Emphasize opening and closing price ratios
-
Line and Area Charts – Monitor closing prices and general trends
-
Heikin Ashi – Eliminate market noise for better trend detection
-
Bar Charts – Observe price ranges with classic OHLC presentation
-
Specialized Options – Such as Step Line, HLC Area, Baseline, and Columns
All types of charts have their applications, and you can tailor your analysis to many types of market environments and trading systems. User can Instantly switch views with one click and may also catch trends that would otherwise go unnoticed.
Chart Types to Match Every Strategy
Switch between chart styles to suit your personal approach or market conditions—instantly:
Candlestick & Hollow Candles – Classic setups for reading price action with precision.
Line, Area & Baseline Charts – Perfect for spotting longer-term trends.
Heikin Ashi – Smooth out price noise for cleaner trend identification.
Bar, Column, HLC, Step Line – Get granular or broad views of price movement.
Every chart type serves a purpose—and now you can access them all with just one click.
Powerful Technical Indicators in Your Hands
Enhance your analysis using TradingView's comprehensive selection of technical indicators:

-
Moving Averages – Monitor underlying trends using periodical intervals
-
52 Week High/Low – Contextualize recent price action
-
Bollinger Bands – Quantify volatility and locate possible reversal points
-
Oscillators – RSI, MACD, and Awesome Oscillator to determine overbought/oversold conditions
-
Directional Indicators – Aroon through to Average Directional Index for trend strength
-
Volume Studies – Verify price movement using accumulation/distribution indicators
With dozens of indicators to choose from, from simple trend-following oscillators to advanced statistical indicators, you'll never be short on verification analysis. Users can use multiple indicators to develop a complete view of market conditions all in the same chart window.
Powerful Technical Indicators at Your Fingertips
Enhance your analysis with TradingView’s comprehensive suite of technical indicators:
Moving Averages – Track underlying trends across various time intervals.
52-Week High/Low – Contextualize recent price movements within a broader timeframe.
Bollinger Bands – Measure volatility and identify potential reversal zones.
Oscillators – Utilize RSI, MACD, and the Awesome Oscillator to assess overbought or oversold conditions.
Directional Indicators – From Aroon to Average Directional Index, evaluate the strength and direction of trends.
Volume Studies – Confirm price movements through accumulation and distribution metrics.
An expansive selection of indicators awaits your command, encompassing everything from fundamental trend-following tools to intricate statistical models. This rich analytical arsenal empowers you to navigate the markets with greater confidence and precision. Multiple indicators can be effortlessly integrated within a single charting interface, offering a layered and comprehensive perspective on evolving market dynamics.
Your Trading Style, Your Charts
Your charts should be as unique as your approach to the markets. The TradingView integration provides full customization features:
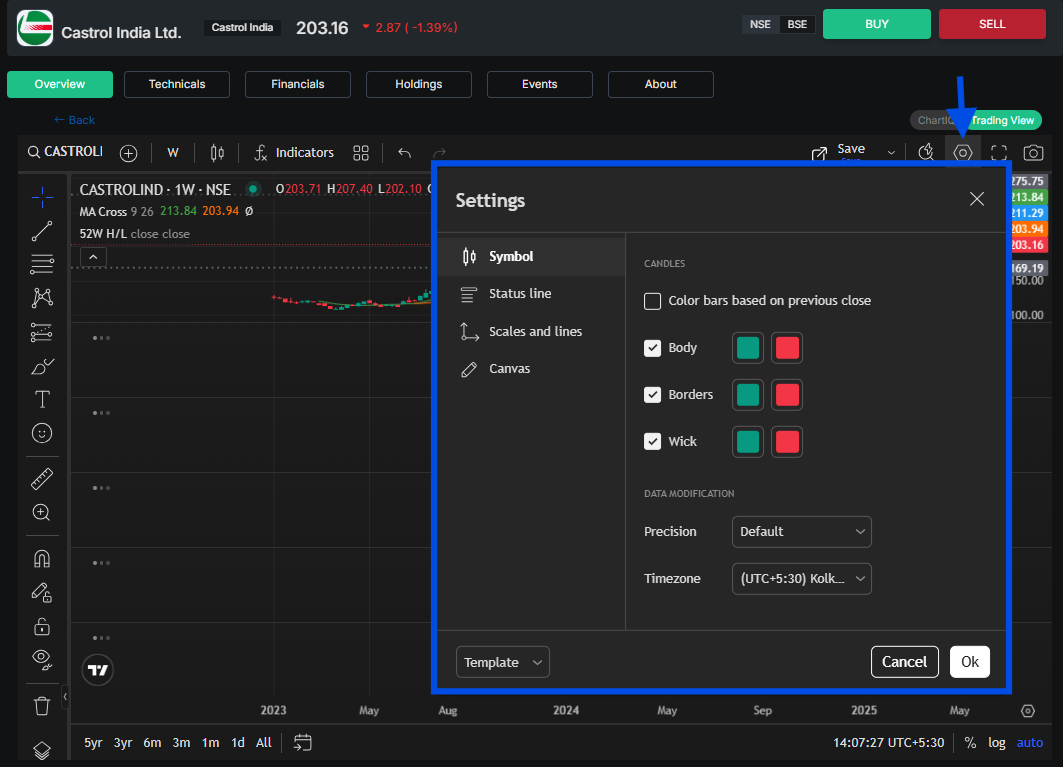
- Color Schemes – Change candle colors for up (green) and down (red) moves
-
Component Control – Turn on/off display of bodies, borders, and wicks
-
Time Zone Settings – Align charts with your local trading times (UTC+5:30 Kolkata in our case)
-
Precision Control – Adjust decimal display according to your instrument's features
Save your favorite settings as templates to ensure consistency across all analyses, saving time and effort for each new trading session.
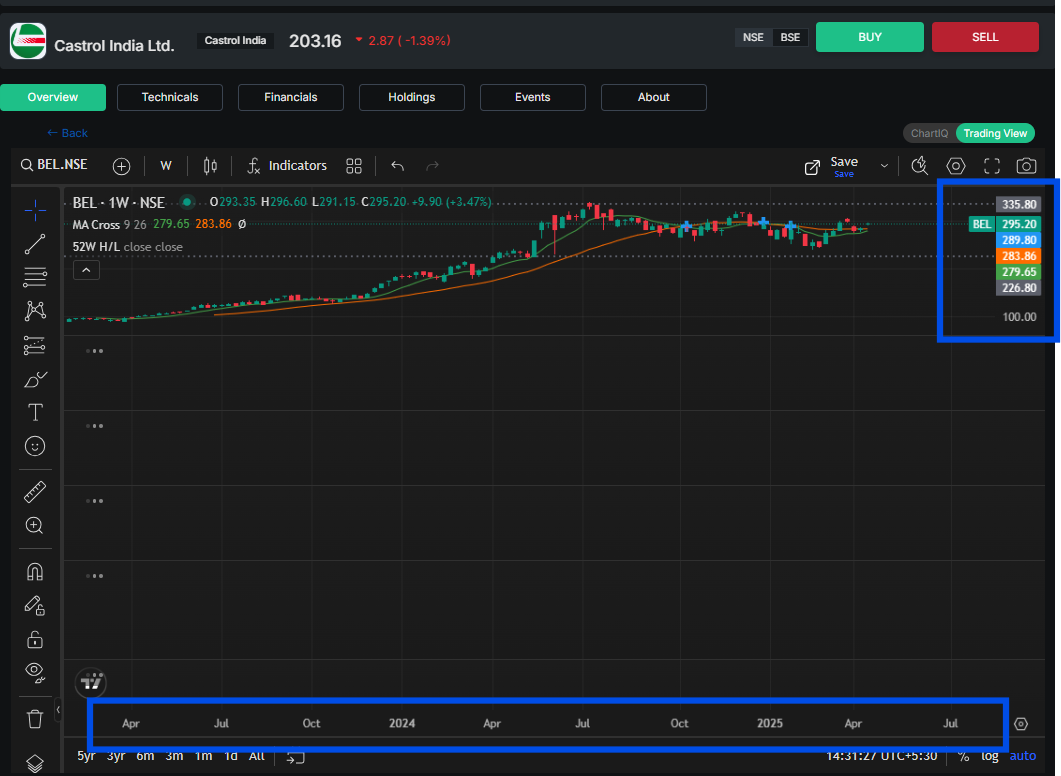
Simple Multi-Timeframe Analysis
Markets fluctuate on various cycles, and good traders analyze various time frames. With the integration of TradingView, it is now simpler so that you can conveniently switch between:
-
Minute by minute intraday charts for intraday trading opportunity
-
Week view and intraday view for position analysis of a medium term
-
Year view and month view for long term trend
As can be observed from our example, you are able to track price action from Rs.100 in 2023 to more than Rs.200 through 2025 in the mindset of a week, and then zoom in down into intraday action for exact points of entry as well as exit. 5yr, 3yr, 6m, 3m, 1m, 1d, and All timeframes can be seen with one click of the mouse.
Why Switch to TradingView on ORCA Web Today
Your ORCA Web experience just improved significantly with the inclusion of TradingView Charts integration:
-
Professional-Grade Analysis – Leverage the same analysis as institutional traders
-
Intuitive Interface – Float through complicated market data effortlessly
-
Comprehensive Coverage – Apply advanced analysis to your entire investment portfolio
-
Real-Time Updates – Act on real-time market activity
-
Trading Edge – Spot opportunities others will not with enhanced visualization
Why Make the Switch to TradingView on ORCA Web Today?
Your ORCA Web experience has reached a new pinnacle with the seamless integration of TradingView Charts:
Institutional-Grade Insights – Harness the analytical power trusted by professional and institutional traders.
Elegant User Interface – Navigate complex market data with fluidity and ease.
Holistic Market Coverage – Apply sophisticated analysis tools across your entire portfolio with precision.
Live Market Intelligence – Respond swiftly to real-time market fluctuations and emerging trends.
A Strategic Trading Advantage – Uncover high-probability opportunities through advanced visualizations that others may overlook.
Sign Up Now
Tap the strength of TradingView Charts on Enrich Money’s
ORCA Web today by logging in. From studying any stock’s charting of its technical or discovering opportunities in overseas markets, these charting features will transform the way you trade.
The synergy of advanced chart types, top-of-the-line technical indicators, precise market depth data, and easy customization ensures a trading experience where analysis and execution complement each other in complete harmony.
Ditch the minimalist charts and superficial analysis. Bring your trading to the next level with ORCA Web's seamless integration of TradingView—where sophisticated charting and intuitive design converge. Sign in now and unlock the full potential of TradingView!
Get Started Today
Experience the full potential of TradingView Charts on Enrich Money’s ORCA Web. Analyze stocks, explore global opportunities, and make smarter trading decisions with advanced charting tools, real-time data, and intelligent indicators, all within a unified platform.
Leave behind basic tools and limited insights. ORCA Web with TradingView delivers precision, speed, and sophistication. Log in today and elevate your trading experience.
Disclaimer: This blog is dedicated exclusively for educational purposes. Please note that the securities and investments mentioned here are provided for informative purposes only and should not be construed as recommendations. Kindly ensure thorough research prior to making any investment decisions. Participation in the securities market carries inherent risks, and it's important to carefully review all associated documents before committing to investments. Please be aware that the attainment of investment objectives is not guaranteed. It's important to note that the past performance of securities and instruments does not reliably predict future performance.
